
Written by: Paul Foster, Founder, CEO, OnePlan
Key Takeaways
- Accurate capacity planning protects attendees, satisfies permitting authorities, and gives emergency services reliable baseline numbers for outdoor Christmas markets.
- Use a six-step process: measure gross site area, subtract obstructions, apply zone-specific density ranges, add a 10–15% safety buffer, document for permits, and validate with live mapping tools.
- IBC and NFPA standards recommend 5 sq ft per person for standing space and 10+ sq ft per person for comfortable browsing zones, with separate calculations for food stall queues and walkways.
- Live mapping tools remove manual recalculations when layouts change, updating net usable area and capacity figures automatically as stalls, stages, and barriers move.
- Book a demo with OnePlan to automate capacity calculations on a live, to-scale map and generate permit-ready documentation instantly.
Why Capacity Planning Is Critical for Christmas Markets
Christmas markets are among the most densely attended outdoor events of the year. Prague’s Old Town Square draws large crowds on a typical Saturday afternoon, and Wrocław’s 2025/2026 market attracted more than one million visitors across its season. Even a modest community market can see sharp crowd spikes around food stalls, entertainment stages, and evening lighting events.
Accurate capacity planning protects attendees, satisfies permitting authorities, helps vendors plan stock and staffing, and gives emergency services a reliable baseline for response planning. Requirements vary significantly by jurisdiction, so confirm the applicable rules with your local fire marshal, parks department, or relevant authority before finalizing any numbers.
Step 1: Measure the Market’s Gross Site Area
Gross site area is the total footprint of the market boundary before any deductions. Measure it in square feet using one of three methods:
- On-site measurement: Walk the perimeter with a measuring wheel or laser distance meter and record each boundary segment.
- Satellite mapping: Trace the boundary on an up-to-date satellite map and read the area directly. OnePlan’s area calculator does this instantly when you draw any polygon on the map.
- Survey documents: Use an existing site survey or park plan, converting any metric figures to square feet (1 m² = 10.76 sq ft).
Record the gross area as a single confirmed figure. Every subsequent step depends on it, so an error here compounds through the entire calculation.
Step 2: Deduct Stalls, Stages, and Fixed Obstructions
Gross area includes every square foot inside the boundary, including space that attendees cannot occupy. Areas occupied by permanent or temporary structures, such as stage platforms, sound towers, production areas, first aid posts, and catering units, must be deducted from the total floor area before capacity calculations are performed.
Common deductions at a Christmas market include:
- Vendor stall footprints, including structure and service counter depth
- Stage platforms and backstage production areas
- First aid and welfare tents
- Generator enclosures and cable runs
- Permanent site features such as trees, planters, fountains, and monuments
- Emergency vehicle access lanes
Worked example. Your market occupies a town square with a gross area of 40,000 sq ft. You have 40 vendor stalls averaging 100 sq ft each (4,000 sq ft total), a stage platform of 1,200 sq ft, a first aid tent of 400 sq ft, and a generator enclosure of 200 sq ft. Total obstructions equal 5,800 sq ft, which is a 14.5% deduction. Net usable area is 34,200 sq ft.
Obstruction deductions vary depending on stall density and site layout. A tightly packed artisan market with double rows of stalls will sit toward the higher end, while a market with wide central walkways will sit lower. Always measure actual footprints rather than estimating. With your net usable area calculated, you are ready to convert that square footage into an attendee count.
Step 3: Apply Density Ranges for Browsing and Queue Zones
Use your net usable area and divide it by a density factor to produce a raw attendee count. The density factor you choose should match how the crowd uses each part of the space. Christmas markets typically involve at least two distinct crowd behaviors that require different density assumptions.
IBC and NFPA standards list loose gathering events such as outdoor markets and casual standing at 5 sq ft per person. IBC Table 1004.5 lists standing space at 5 sq ft per person and concentrated seating (chairs only) at 7 sq ft per person; NFPA 101 uses similar factors. Guidance also exists for zones with free movement such as vendor rows and walkways.
| Zone Type | Density Range (sq ft per person) | Typical Application |
|---|---|---|
| Comfortable browsing / open walkways | 10 or more sq ft per person | Main pedestrian aisles, open plaza areas, vendor browsing rows |
| Food stall queuing / high-dwell zones | 5 sq ft per person | Queue lines at hot food stalls, mulled wine bars, entertainment stage front |
Apply the appropriate density to each zone separately rather than using a single figure for the whole site. A market with 20,000 sq ft of open walkway and 14,200 sq ft of food-stall queue zones will produce a more accurate result than one blanket calculation. For modeling how crowds arrive and exit the site, use OnePlan’s free arrival calculator and exit calculator to estimate queue lengths and exit flow rates.
Step 4: Add a 10–15% Safety Buffer to Your Capacity
Apply a 10–15% safety buffer by reducing your raw calculated capacity by that percentage before treating it as your permitted maximum. This buffer protects against unpredictable variables that affect real-world crowd behavior, which a static calculation cannot anticipate. Specifically, it absorbs:
- Staff, volunteers, and vendor personnel moving through public areas
- Unplanned queue overflow from popular stalls
- Weather-driven crowd surges toward covered or sheltered zones
- Last-minute layout changes that reduce usable area
Continuing the worked example, if the zone-by-zone calculation produces a raw capacity of 3,200 people, a 15% buffer reduces the permitted maximum to 2,720. Present that figure to the permitting authority.
Step 5: Prepare Permit-Ready Capacity Documentation
A capacity number without supporting documentation rarely satisfies a permitting authority. Planners must mathematically prove both maximum occupancy and egress capacity to fire marshals and city planners to ensure regulatory compliance. Prepare a permit package that includes:
- A to-scale site map showing the market boundary, all obstructions, and zone designations
- A written calculation showing gross area, each deduction with its measurement, the density factor applied per zone, the raw capacity, and the buffered final figure
- An inventory of all temporary structures (stalls, stages, tents, generators) with dimensions
- Egress route widths and exit capacity calculations
- Emergency vehicle access routes marked on the site map
Keep every document version-controlled with a date stamp so reviewers always see the latest plan. Permitting reviewers frequently request revisions, and submitting an outdated version of the site map is one of the most common causes of delays.
Step 6: Validate Capacity with Live Mapping Tools
Manual calculations on spreadsheets work for static layouts, but they break down the moment the layout changes. Move a stall row, add a stage, or shift an emergency access lane, and every area figure needs recalculating by hand. Live mapping tools remove that rework.
OnePlan’s crowd capacity calculator lets you draw any zone directly on a satellite map and instantly see its standing capacity based on your chosen density. Every object placed on the map, including stalls, stages, tents, and barriers, is to scale, so the net usable area updates automatically as the layout evolves. The auto-generated Bill of Quantities turns the finished map into an exportable inventory of every structure on site, ready for permit submissions and contractor coordination. “One of the features I like most right now is the crowd measurement feature. It’s so helpful to measure how many people you’re going to fit in a small area.” (Ehrabi Nael, Race Director, Beirut Marathon)
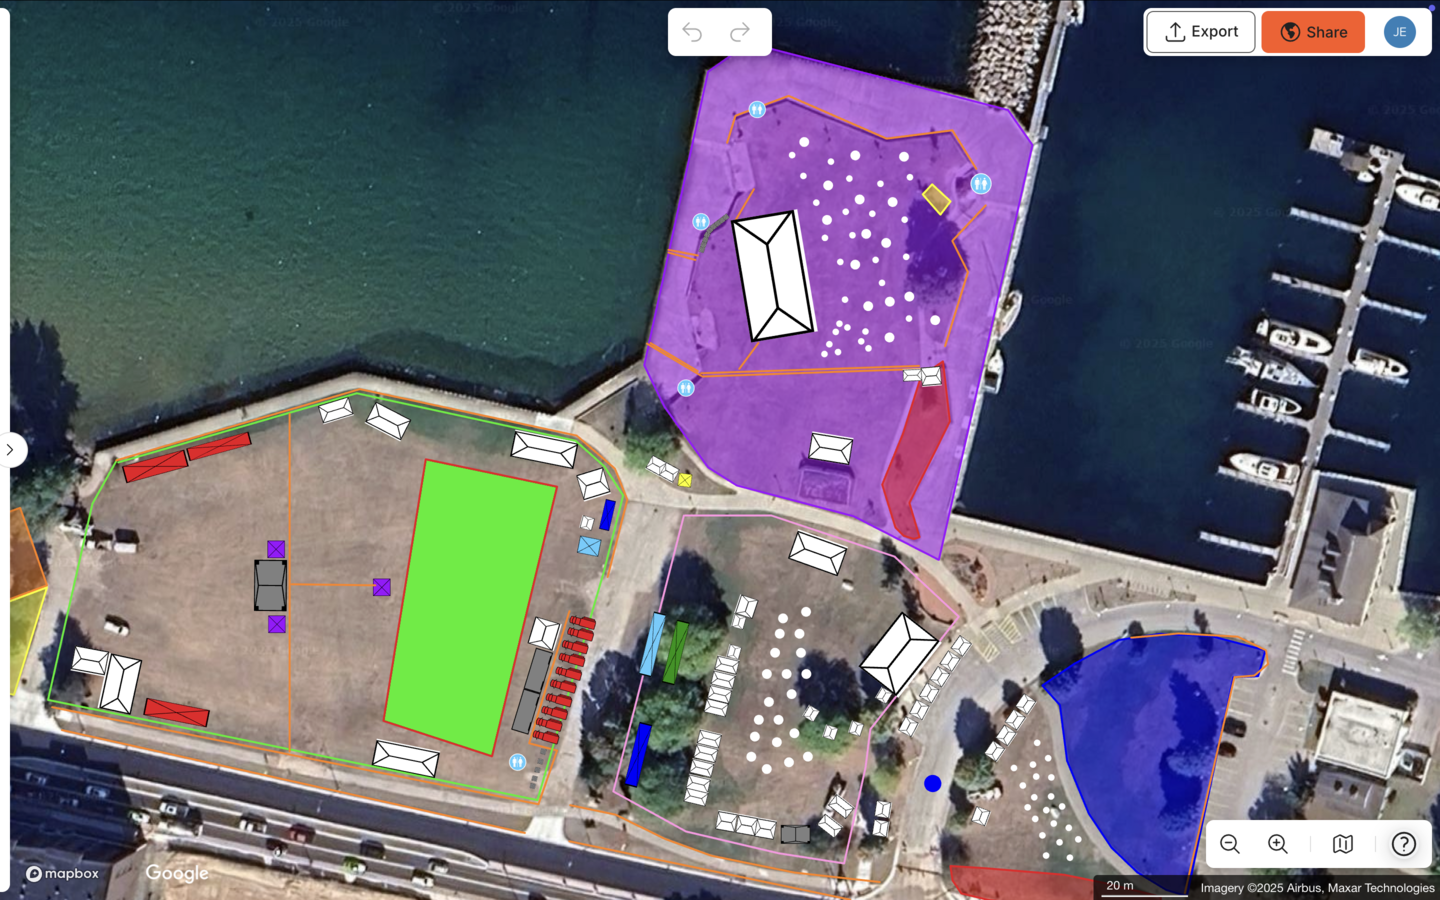
“The calculations for crowd capacity and parking areas are great. It’s nice to have a visual shape on our plan that shows me I can get 7,000 people at one person per square metre in there.” (Tom Newton, Director, Bearfoot Productions)
See how OnePlan eliminates manual recalculations and keeps your capacity figures accurate in a 15-minute walkthrough.
Common Capacity Planning Challenges to Avoid
Version control. When the site map lives in a spreadsheet or static PDF, every layout change produces a new file. Departments end up working from different versions, and the capacity figure on the permit may not match the layout on the ground. Use a single live plan that all stakeholders access from one link.
Underestimating queue space. Food stall queues at Christmas markets extend well into the pedestrian walkway, reducing the effective browsing area and increasing local density. Footfall data enables food-and-beverage operators to anticipate queue formation by providing hourly dwell and occupancy forecasts for specific streets and stalls. Plan queue zones explicitly on the site map rather than absorbing them into the general walkway area.
Last-minute layout changes. A vendor cancellation, a weather shelter addition, or a relocated stage can shift net usable area by thousands of square feet. Sudden weather shifts cause crowds to surge toward shelter, collapse queues, and congest exits and emergency routes, so capacity plans must be live documents, not fixed submissions. Build the habit of recalculating capacity every time the layout changes, not just at the point of permit submission.
Evening peak density. Teams set zone-specific safety thresholds before crowding becomes an incident, directly supporting evening operations when demand shifts, such as the post-music peak after 6 p.m. Plan for evening peaks explicitly by identifying which zones will experience the highest dwell times after dark and ensuring egress routes remain clear.
Success Indicators for Your Capacity Plan
A well-executed capacity planning process produces measurable results before and after the event:
- Fewer permit revision cycles, because the submitted documentation matches the actual layout
- Smoother reviews with fire marshals and parks departments, because the calculation methodology is transparent and reproducible
- Accurate vendor counts via the Bill of Quantities, reducing over-ordering of barriers, fencing, and temporary structures
- Faster response to layout changes, because the capacity figure updates as the map updates rather than requiring a separate recalculation
The Cheese & Chilli Festival uses OnePlan’s crowd area measurement and safety calculation tools for risk assessments and management plans across four annual events with up to 9,000 attendees and more than 120 food vendors, a scale directly comparable to many Christmas markets.
Advanced: Reuse Templates and Collaborate Across Teams
If your market runs annually in the same location, this year’s site map becomes the starting point for next year. In OnePlan, the entire plan, including boundary, stall placements, zone designations, capacity calculations, and Bill of Quantities, saves as a reusable template. Next year’s organizer opens the template, updates vendor placements, and the capacity figures recalculate automatically.
Cross-department collaboration stays straightforward when everyone works from the same live plan. Operations, parks staff, the fire department, and vendor managers all access the same link. When the operations team moves a stall row, every other department sees the updated layout immediately, with no re-sending files and no version confusion. Eagle Mountain City cut event planning from 8–10 hours down to a few hours per event and reported a 5x ROI after moving to a single shared plan across departments.
Frequently Asked Questions
How far in advance should I calculate capacity for a Christmas market?
Start the capacity calculation as soon as the site boundary and vendor layout are confirmed, typically 8 to 12 weeks before the market opens. This timing gives enough lead time to submit permit documentation, respond to revision requests, and adjust the layout if the initial capacity figure is too low or too high for the planned vendor count. Recalculate whenever the layout changes materially.
Which stakeholders need to be involved in the capacity planning process?
At minimum, involve the event organizer, the parks or public works department responsible for the site, and the local fire marshal or fire department. Depending on your jurisdiction and market size, you may also need input from the police department for crowd management and road closures, emergency medical services, and the city or county permitting office. Confirm the required stakeholders with your local authority early in the planning process.
What format should the permit documentation be in?
Most permitting authorities accept a to-scale site map, printed or digital, typically PDF or high-resolution image, accompanied by a written capacity calculation and a structure inventory. Some jurisdictions specify minimum map scales or require dimensions to be annotated directly on the plan. Check with your local fire marshal or permitting office for format requirements specific to your area. OnePlan exports high-resolution maps and Bill of Quantities reports that meet standard permitting expectations.
When should I move from a spreadsheet to a dedicated planning platform?
A spreadsheet works for a single-zone market with a stable layout and one person managing the plan. It becomes a liability when the layout changes frequently, when multiple departments need to work from the same plan, or when the permit documentation needs to match a to-scale site map. If you spend more time managing file versions than planning the event, or if a layout change requires recalculating capacity manually across multiple zones, a dedicated platform will save significant time and reduce the risk of submitting outdated documentation.
How do I account for weather-driven crowd surges in my capacity calculation?
Weather surges, such as crowds moving toward covered stalls or sheltered areas during rain or cold snaps, are best handled by calculating capacity for covered and semi-covered zones separately at a higher density than open walkways and ensuring those zones have adequate egress. Build the 10–15% safety buffer with weather surges in mind, and identify in advance which zones will be closed or restricted if conditions deteriorate. Document these contingency thresholds in your permit package so the relevant authorities understand the response plan.
Conclusion
Calculating safe standing attendee capacity for an outdoor Christmas market follows a clear sequence. Measure gross site area, subtract all obstructions, apply zone-specific density ranges, reduce by a 10–15% safety buffer, document the methodology for permits, and validate the layout on a live map. Each step is reproducible, defensible, and repeatable year after year.
OnePlan automates every step of that process on a to-scale satellite map, drawing zones, calculating capacity, generating a Bill of Quantities, and exporting permit-ready documentation. Your team spends less time on spreadsheets and more time planning a market people will want to come back to.
Plan your next event the easy way. Book a 15-minute demo to see OnePlan in action, or get started free, with your first event on us.